Table of Contents
ToggleOverview of Rustomjee Share Price ( Keystone Realtors)
Rustomjee, officially known as Keystone Realtors Limited, is a prominent player in India’s real estate sector. The company focuses on
- Residential Projects: From affordable housing to luxury apartments and gated communities.
- Commercial Real Estate: Including corporate parks and retail spaces.
- Integrated Townships: Offering comprehensive living solutions.
- Re-development Projects: Revitalizing older properties.
- Stalled Projects: Taking over and completing projects that were halted by other developers.
Key Financial Highlights of Rustomjee Share
Valuation Metrics:
- Market Cap: ₹9,405.39 Cr. – Indicates the company’s total market value.
- Enterprise Value: ₹9,510.87 Cr. – Represents the total value of the company, including debt.
- P/E Ratio: 159.96 – High P/E suggests investors have high expectations for future earnings growth.
- P/B Ratio: 3.8 – Indicates the market is willing to pay significantly more than the book value of the company’s assets.
Financial Health:
- Book Value: ₹196.55 – Represents the net asset value per share.
- Cash: ₹346.31 Cr. – A positive cash balance can be beneficial for operations.
- Debt: ₹451.79 Cr. – The company has a debt burden to manage.
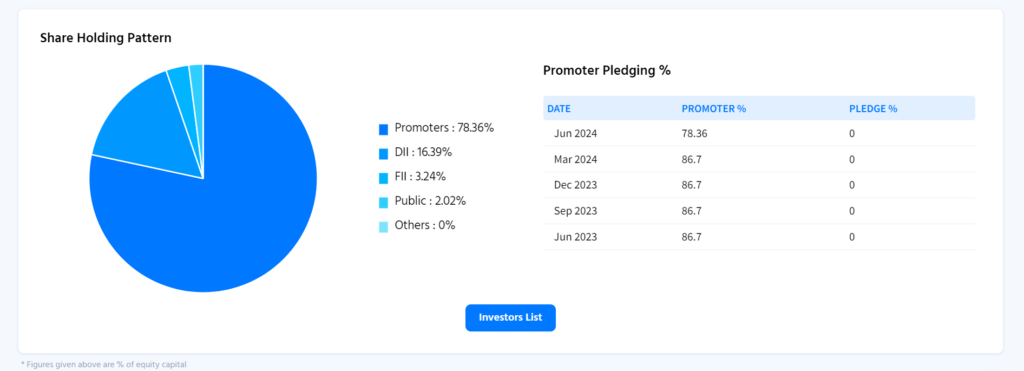
- Promoter Holding: 78.36% – Significant promoter holding indicates confidence in the company’s future.
Profitability and Growth:
- EPS: ₹4.67 – Earnings per share, a measure of profitability.
- Sales Growth: -61.47% – Negative sales growth indicates a decline in revenue.
- Profit Growth: -9.02% – Negative profit growth suggests declining profitability.
- ROE: 9.85% – Return on equity measures how efficiently the company generates profit from shareholder investments.
- ROCE: 8.92% – Return on capital employed indicates the efficiency of capital utilization.
DATA from TICKER BY FINOLOGY about RUSTOMJEE
Technical Analysis of Rustomjee ( Keystone Realtors Share Price)
Disclaimer: This analysis is based solely on the provided chart and does not constitute financial advice. It’s essential to conduct thorough research and consider multiple factors before making investment decisions.
Overview
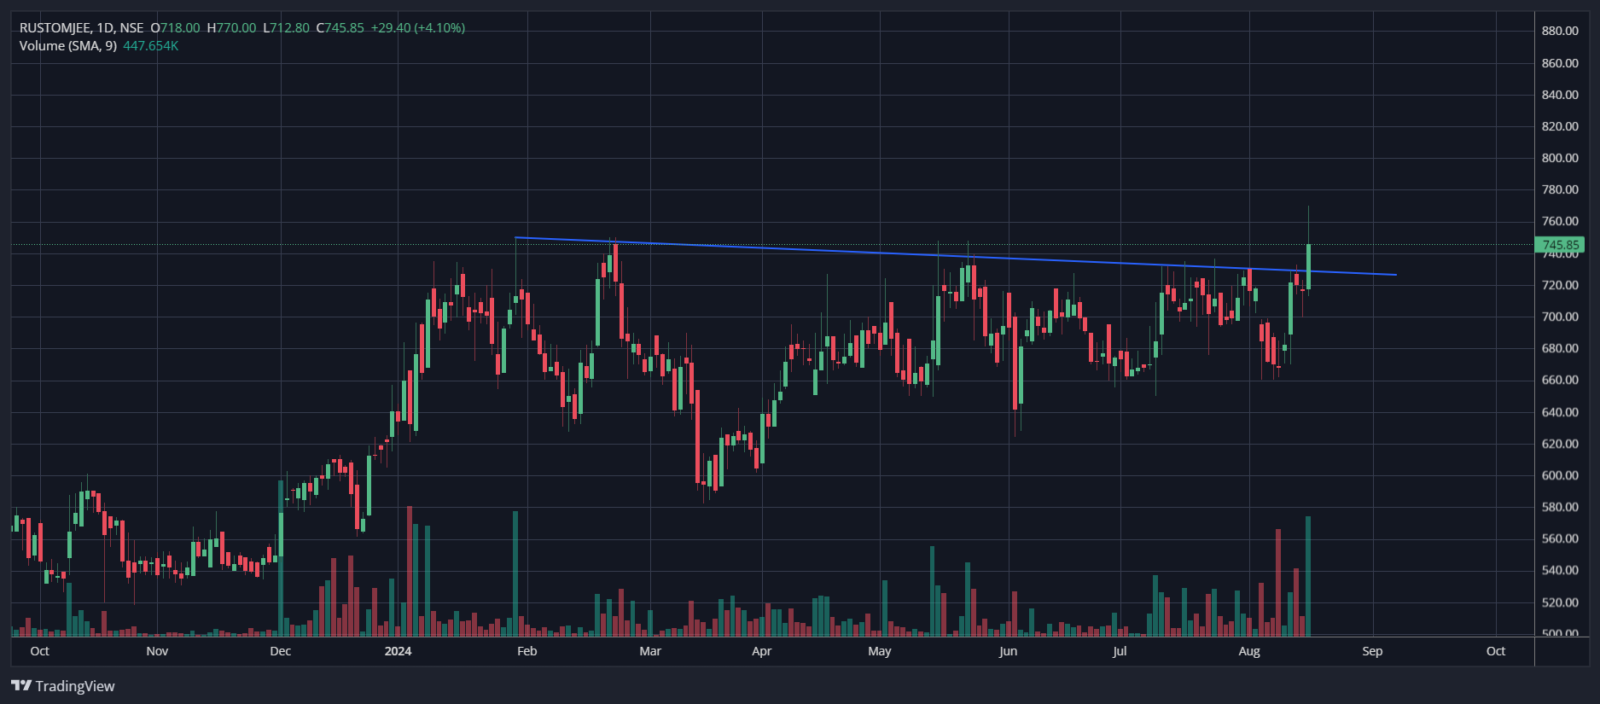
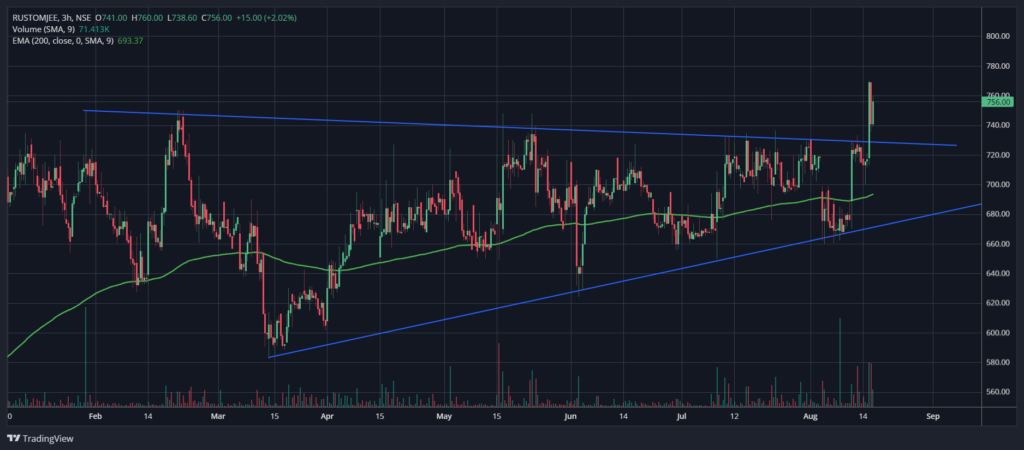
The chart of Rustomjee (Keystone share price) presents a bullish outlook with a recent breakout from a descending trendline.
Key Observations:
- Descending Trendline Breakout: The stock has been trading within a descending trendline for several months. A recent breakout above this trendline indicates a potential shift in momentum in favor of the bulls.
- Increased Trading Volume: The breakout was accompanied by an increase in trading volume, suggesting strong buying interest and confirming the validity of the breakout.
- Support and Resistance: The broken trendline might now act as support. Identifying potential resistance levels above the breakout point could be crucial for setting profit targets.
Potential Outlook:
- Bullish Continuation: If the buying pressure persists and the stock closes consistently above the breakout level, it could lead to a sustained uptrend.
- Retracement: A temporary pullback to retest the broken trendline as support is possible before resuming the uptrend.
- False Breakout: While unlikely due to the increased volume, there’s always a risk of a false breakout where the price retraces below the trendline.
Further Analysis:
To gain a more comprehensive understanding of the stock’s potential, consider the following:
- Fundamental Analysis: Assessing the company’s financial health, industry trends, and overall economic conditions can help determine the stock’s intrinsic value and support technical analysis findings.
- Risk Management: Implementing stop-loss orders to protect investments and setting clear profit targets is crucial for effective risk management.
