Table of Contents
ToggleLovable Share Price Brief Overview
Lovable Lingerie Ltd is one of India’s leading manufacturers and retailers of women’s innerwear. The company is well-known for its flagship brands, Lovable and Daisy Dee.
Core Business
- Manufacturing: Lovable Lingerie produces a wide range of women’s innerwear products including bras, panties, slips, camisoles, homewear, shapewear, foundation garments, and sleepwear.
- Retail: The company has a strong retail presence across India, offering its products to consumers through its own stores as well as through various retail outlets.
Key Strengths
- Strong Brand Recognition: Lovable is one of the most recognized brands in the Indian women’s innerwear segment.
- Diverse Product Range: The company offers a wide variety of products catering to different customer segments and preferences.
- Retail Network: A robust retail presence helps in reaching a wider customer base.
Fundamental Analysis of Lovable Lingerie Ltd
Based on the financial data of Lovable Share from Ticker by Finology, here’s an analysis of the company’s fundamentals:
Valuation
- The company has a market capitalization of ₹ 223.48 Cr. This indicates the total market value of all outstanding shares.
- The price-to-earnings (P/E) ratio is 65.85. A high P/E ratio could indicate that the stock is expensive relative to its earnings. However, it’s important to compare the P/E ratio to industry averages and growth expectations.
- The price-to-book (P/B) ratio is 1.25. A P/B ratio of less than 1 indicates that the company’s stock price is trading below its book value, which could potentially signal an undervalued stock.
Financial Health
- The book value per share is ₹ 120.56. This represents the company’s net assets per share.
- The company has a cash balance of ₹ 0.45 Cr.
- The company has debt of ₹ 6.90 Cr. A high debt level can be a cause for concern, as it indicates the company’s financial leverage and risk of default.
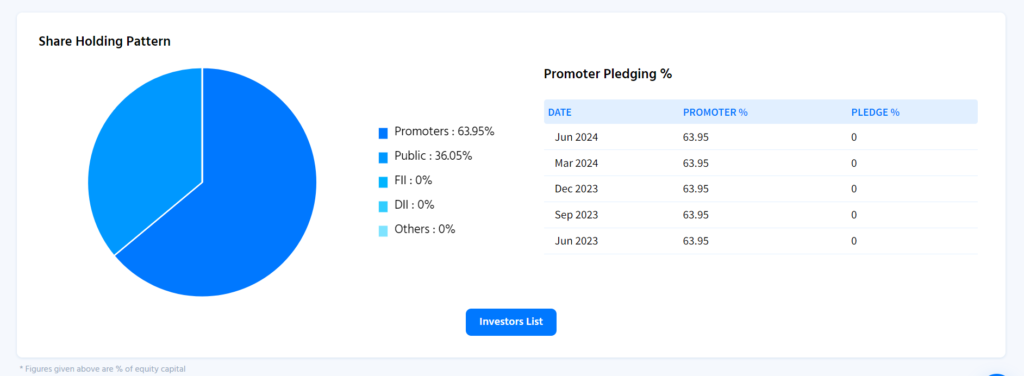
- Promoter holding is 63.95%. High promoter holding can be a positive sign, as it indicates that the promoters are confident in the company’s future prospects.
Profitability
- The earnings per share (EPS) is ₹ 2.29. EPS indicates the company’s profit per share of outstanding stock.
- The company has experienced negative sales growth of -33.23% in the trailing twelve months (TTM). This is a significant concern and warrants further investigation into the reasons behind the decline.
- The return on equity (ROE) is 2.46%. ROE measures the company’s profitability relative to shareholders’ equity. A low ROE might indicate that the company is not generating a good return on its shareholders’ investment.
- The return on capital employed (ROCE) is 3.31%. ROCE measures the company’s profitability relative to the capital it employs.
- The company has experienced a high profit growth of 6,065.18% in the TTM. However, it’s important to consider the context of the previous year’s profitability, as a high growth rate from a low base can be misleading.
Technical Analysis of Lovable Share ( Lovable Lingerie Ltd)
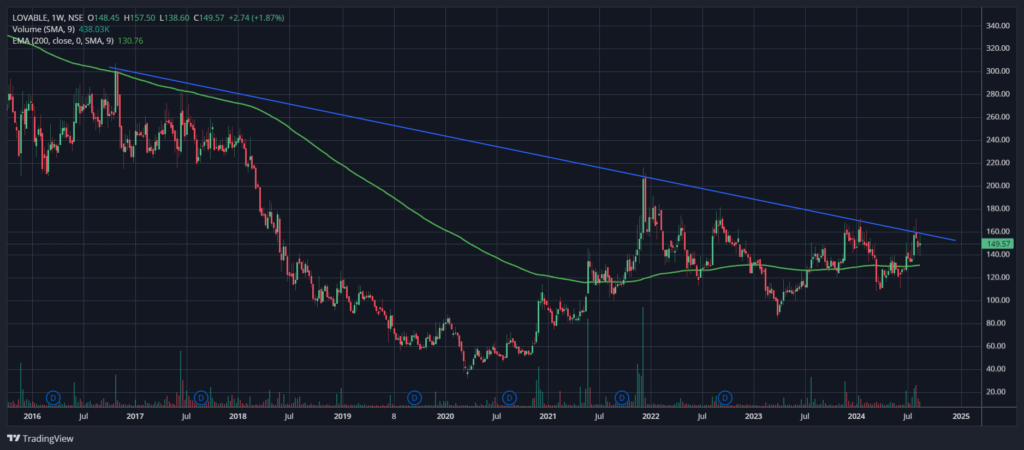
Let’s analyze the weekly chart of Lovable Lingerie Ltd. (LOVABLE) to understand the technical details of the recent breakout.
Key Observations:
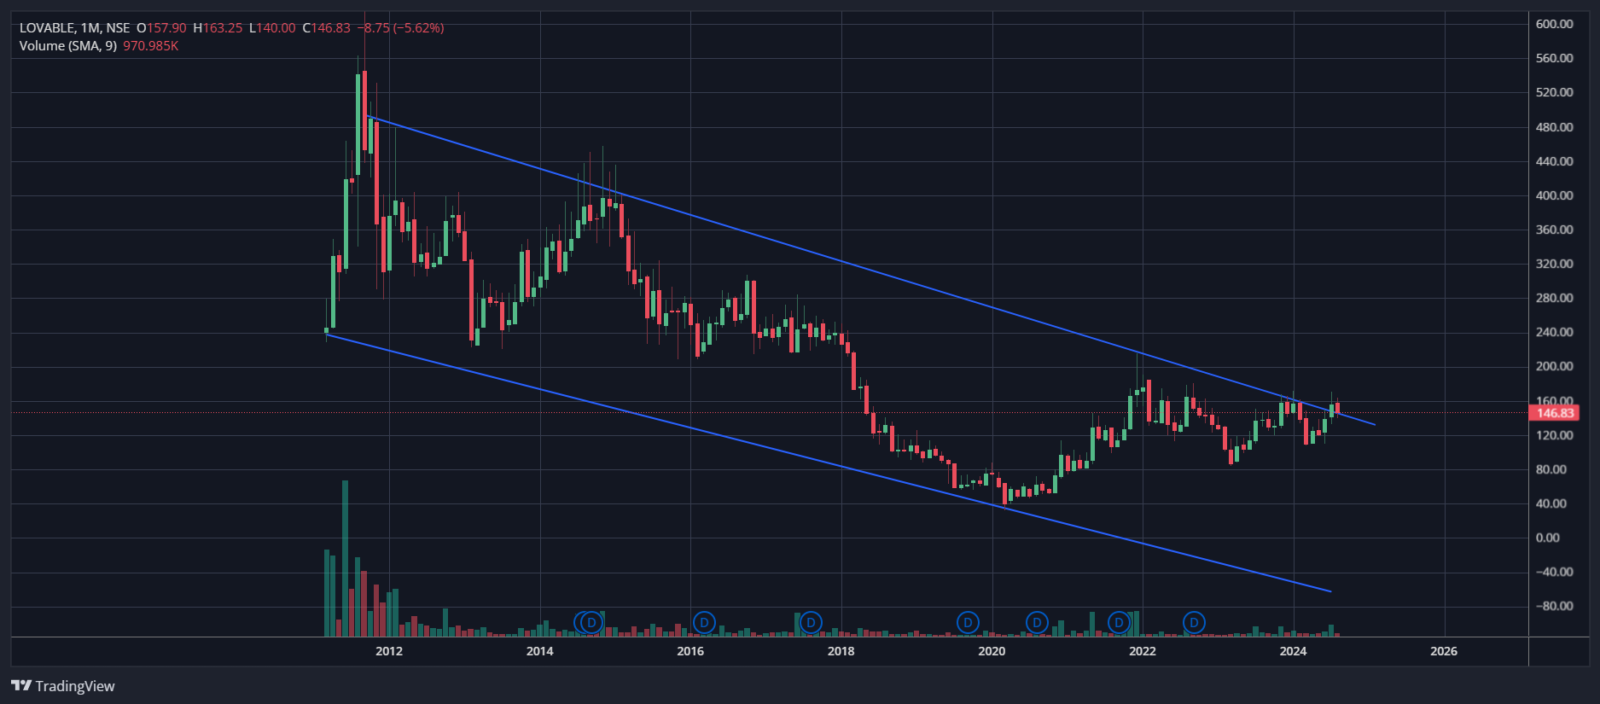
Breakout from Descending Trendline: The chart clearly shows that the stock has been trading within a descending trendline for several years. The breakout above this trendline will be a positive sign for the bulls.
Head and Shoulders: A bullish reverse head and shoulder pattern is also forming starting from 2022 to 2024.
Potential Outlook:
- Bullish Continuation: If the buying pressure persists and the stock continues to close above the breakout level, it could lead to a sustained uptrend.
- Retracement: A temporary pullback to retest the broken trendline as support is possible before the uptrend resumes.
- False Breakout: There is always a risk of a false breakout where the price retraces below the trendline.
Further Analysis of Lovable Share Price:
- Fundamental Analysis: Assessing the company’s financial health in detail, industry trends, and overall economic conditions can help determine the stock’s intrinsic value and support technical analysis findings.
- Risk Management: Implementing stop-loss orders to protect investments and setting clear profit targets is crucial for effective risk management.
Remember: Technical analysis is just one tool in an investor’s toolkit. Combining it with fundamental analysis and considering market conditions is essential for making informed investment decisions.
